Pre/Mid/Post Test
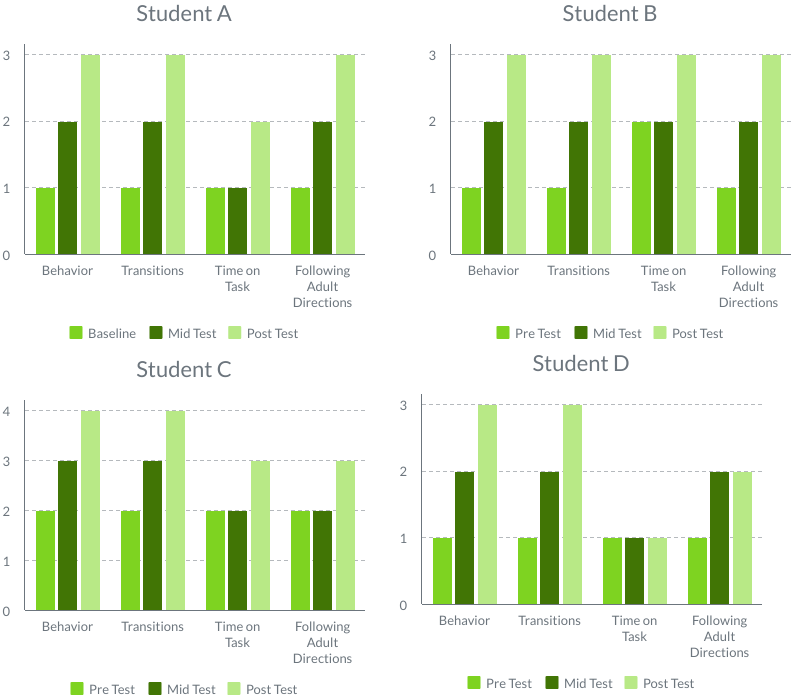
Pre/Mid/Post Test Based on this pre, mid, and post test data all four of my students made progress and increased their independence. Student A went from 20% to 50 %, student B went from 25% to 60%, student C went from a 40% to 70%, Student D went from 20% to 45%. I did not expect any of my students to receive a 100% by the end of the study because this is area of need as indicated on their Individualized Education Plan.
The breakdown of scores to the right indicated that all four students' behavior and ability to transition improved. Students' ability to follow adult direction and stay on task also showed improvement but not as drastic as the two other areas. I suspect this is because students using visual schedules allow them to receive clear expectations that are consistent between all adults which improves their frustration level thus improving behavior. Visual schedules also greatly impact how well students transition because it allows them to have a concrete representation of where they need to be going giving them a clear purpose and expectation during transitions. |
Remaining Questions:
|
T-Test Results
A paired-samples t-test was conducted to determine the effect of visual schedules on students’ independence throughout the school day. There was a significant difference in the scores prior to implementing visual schedules (M=26.25, SD=8.20) and after implementing (M=75.5, SD=9.01) the visual schedules; t(4)= 13.10, p = 0.0005. The observed effect size d is large, 6.53. This indicates that the magnitude of the difference between the average and μ0 is large. These results suggest that the use of visual schedules had a positive effect on students’ independence throughout the school day. Specifically, the results suggest that the use of visual schedules increased all students' independence in the areas of behavior, transitions, time on task, and following directions.
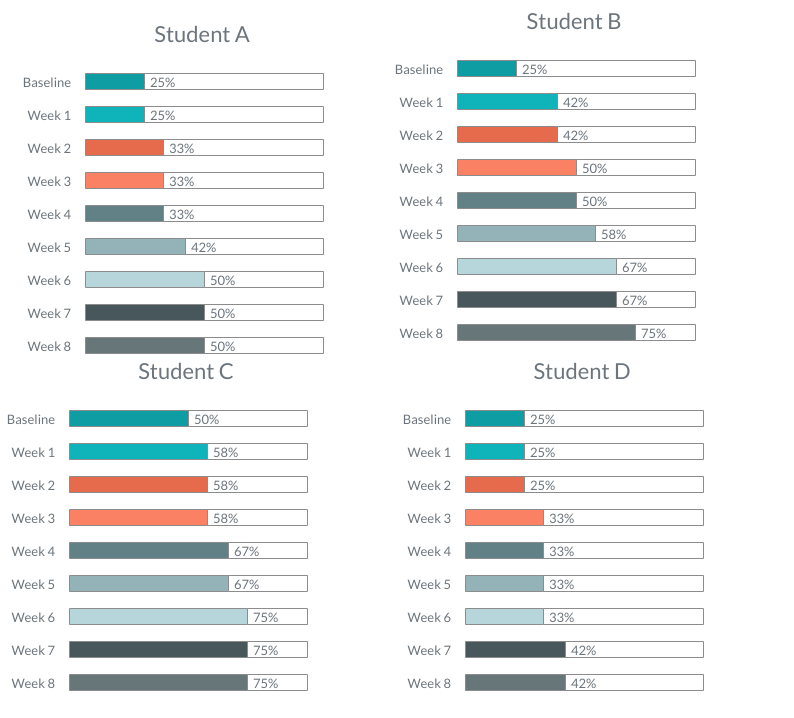
Daily Independence RubricBased on data collected by daily rubrics all four of the students made progress by the end of the eight weeks. I noticed that student A and student D both showed no growth after the first week of implementing a visual schedule. I found this interesting because both of these students are non verbal making it challenging to understand what they know and what they need help with. This data also indicates that students scores stay the same for 2 to 3 weeks before increasing again. This shows that in order for visual schedules to increase students independence they need to be utilized throughout several weeks as it is not a short term intervention rather one these students may utilize for a few years.
|
Remaining Questions:
|
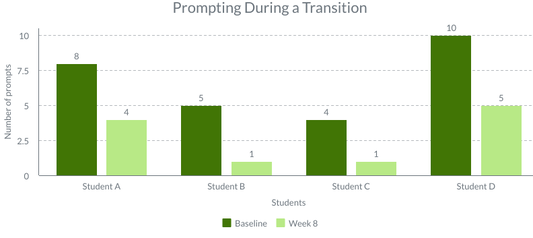
Anecdotal Notes While collecting data on the anecdotal note form I noticed that the number of prompts being used for each student during transitions was decreasing. These prompts include both physical, verbal, gestural, and visual. Based on this information I created a graph that showed the level of prompting needed before visual schedules were implemented and at the end of the eight weeks. The graph shows that the number of prompts needed have significantly decreased thus showing students increased independence.
While taking notes during this study I was also able to notice how using visual schedules for these students have also impacted the teachers. I noted on multiple data sheets that teachers were able to deliver more impactful instruction because they were not spending their time correcting and prompting students. When collaborating with these teachers they informed me that implementing visual schedules in the beginning may seem like a daunting task it is well worth it in the end because it increases students independence thus leading to more instructional time in the classroom. |
Remaining Questions:
|
|
|
